US Economic Overview
The U.S. economy in the third quarter of 2025 demonstrated surprising resilience in terms of GDP growth, despite a softening labor market, stubborn inflation, and policy uncertainty. Upward revisions suggested that U.S. real GDP expanded at an estimated annualized rate of 3.5% in Q3 2025, driven primarily by consumer spending and business AI capital expenditure investment.
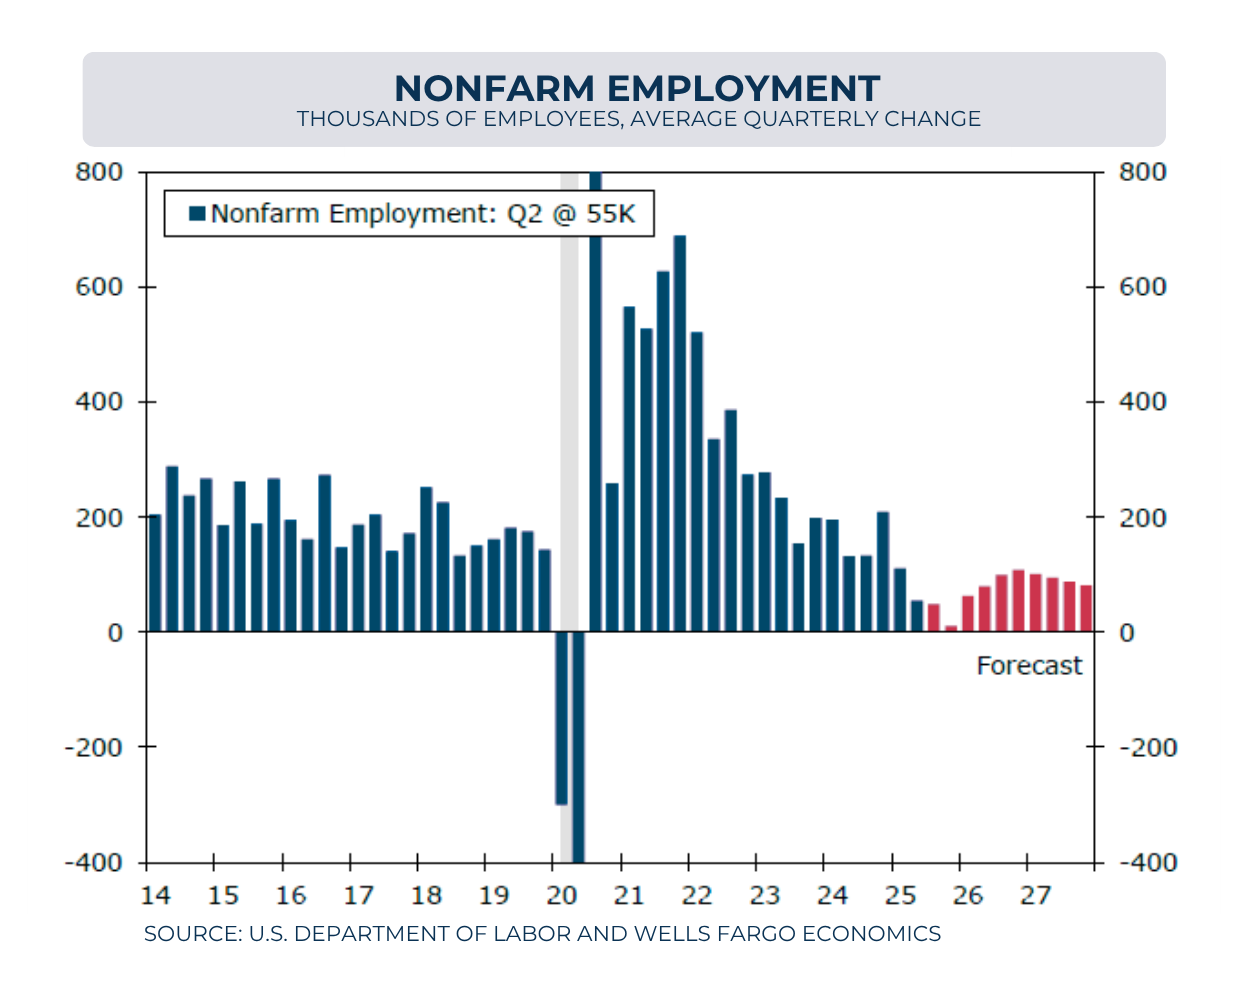
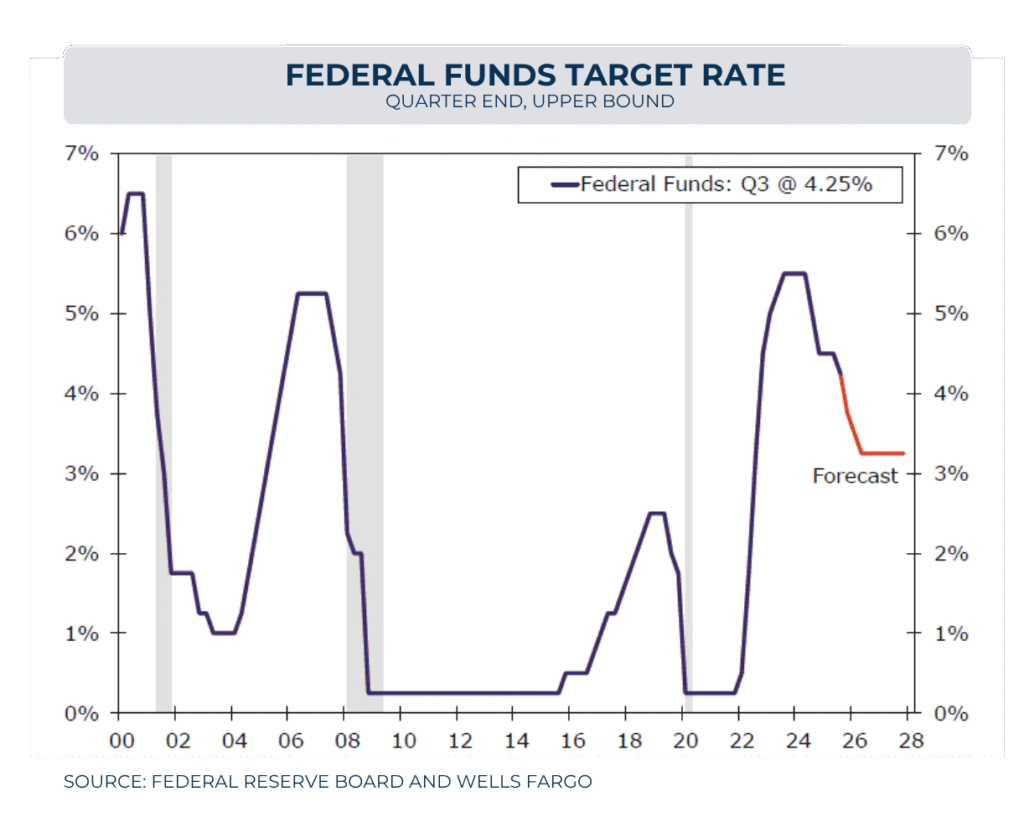
The labor market is transitioning to a more normalized state after years of exceptional tightness. As the government has been shut down since October 1st, Alternative data services (ADP) suggest that employment growth remains soft and is moderating. The unemployment rate is expected to stabilize around 4.5% by year-end—still historically low by pre-pandemic standards. Meanwhile, inflation continued to run above the FOMC’s 2% target. Core PCE averaged 2.9% year-over-year in Q3 2025. After the October cut, The Fed is expected to continue prioritizing the flagging labor market, with a further 25 bps rate cut anticipated in December.
The charts below show the average quarterly change in non-farm employment with a forecast through 2027 as well as the Federal Funds Target Rate and forecast.
US Apartment Market
The 3rd quarter results for national multifamily housing market were mixed. As expected, new apartment deliveries and new construction have slowed a great deal – but demand has also begun to moderate as well.
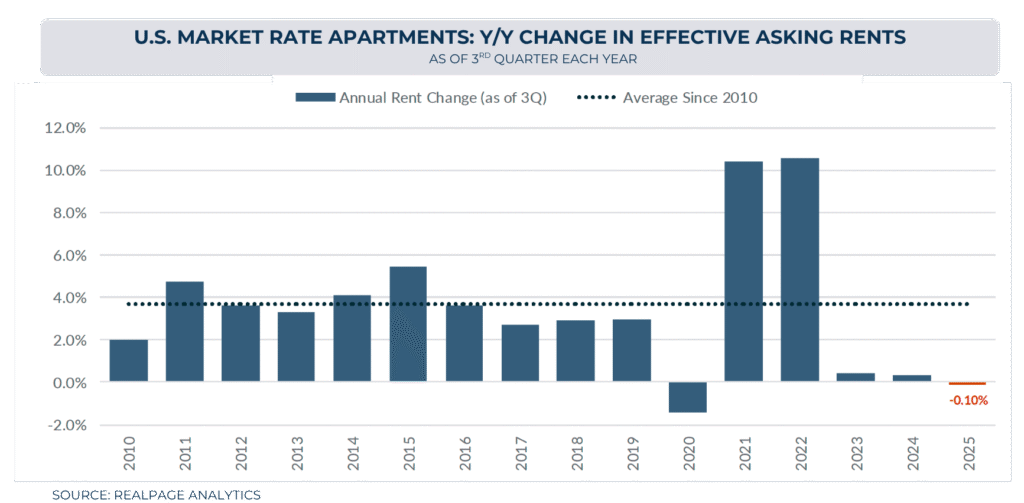
National rent growth was effectively flat at -.1% year over year—a recalibration after unprecedented pandemic-era increases, and notably better than the significant declines seen in 2020.
Below illustrates YOY effective rent growth by quarter – while also showing the average since 2010.
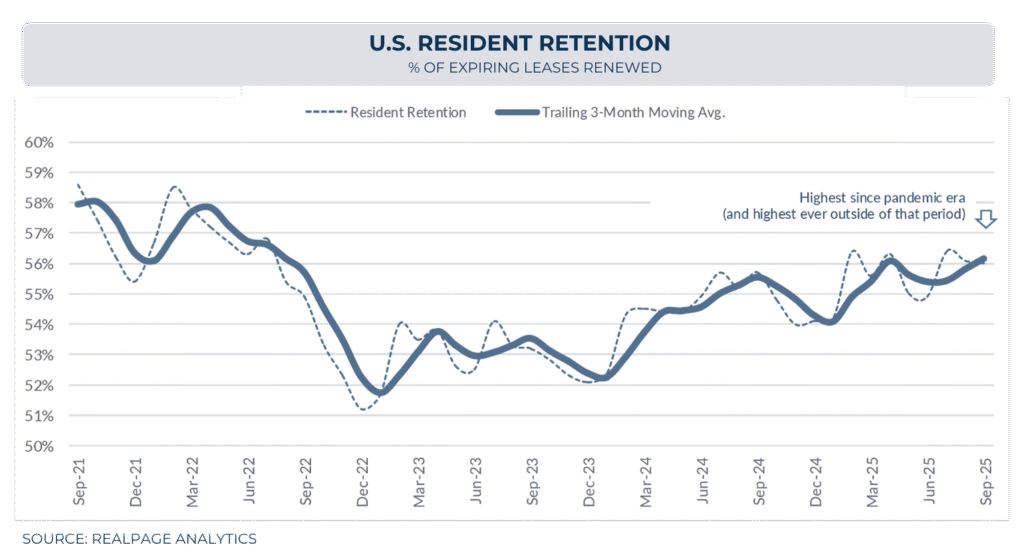
National occupancy remains near record highs at 95.36%. This is the second highest occupancy reading since Q2 2022, only eclipsed by last quarter occupancy of 95.64%. Flat rent growth combined with high occupancy signals that operators are focusing on keeping current tenants rather than increasing rent. This is evident in the current retention rate of 56%, this is the highest since the pandemic era and well above the historic average of ~50%.
The chart below shows the trend of resident retention over the last 4 years.
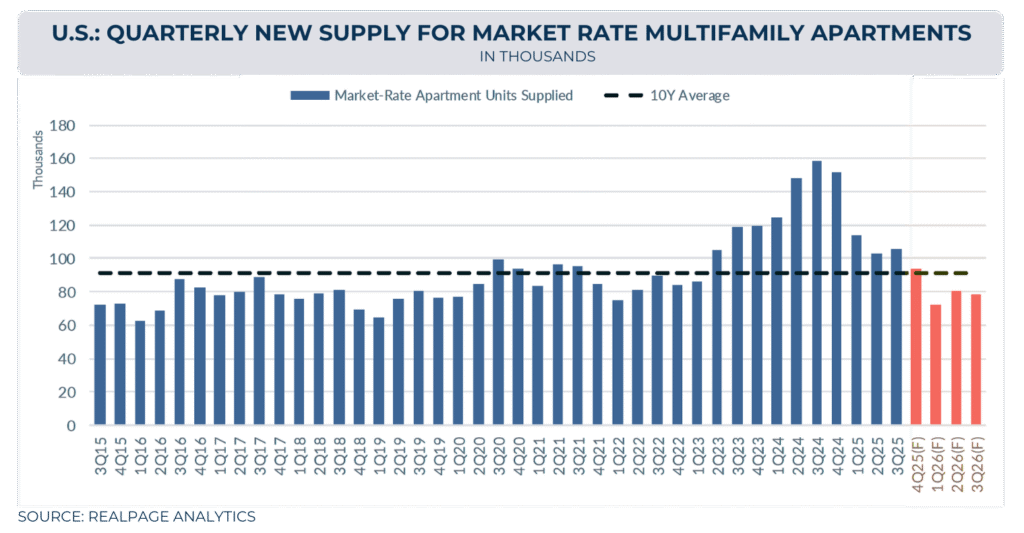
The largest shift in the apartment market has come on the demand side of the equation. Apartment demand was 42K compared to quarterly supply of 105K. This is the first time since Q1 2024 that demand was outpaced by apartment supply. The slowing job market and lower employment rates for new college graduates are believed to be behind slowing demand numbers.
It should be noted that the annual demand of 780K dwarfs any other 12-month period in the RealPage data that extends to the late 1990’s. While the quarter was softer than recent quarters, there was still more demand than supply added in the past 4 quarters (780K Demand to 474K units supplied). With new supply continuing to drop off, less demand will be needed to keep the market in balance.
Below illustrates the number of new apartments delivered along with a 2026 forecast compared to the 10-year average.
Regional Disparity
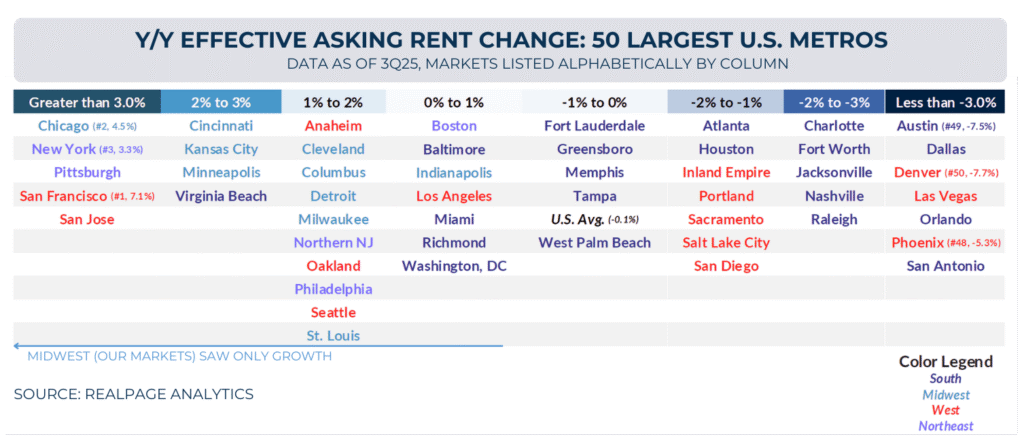
As has been the case for the past 3 years, the Midwest and the northeast continue to outperform the rest of the country when measured by rent growth. Steady demand and lower supply have allowed Ackermann target and current markets to continue to perform well above the national average (-.1%).
The graph below shows the year-over-year rent growth for the top 50 US metros. All major Midwest markets are showing positive rent growth.
Investment Sales
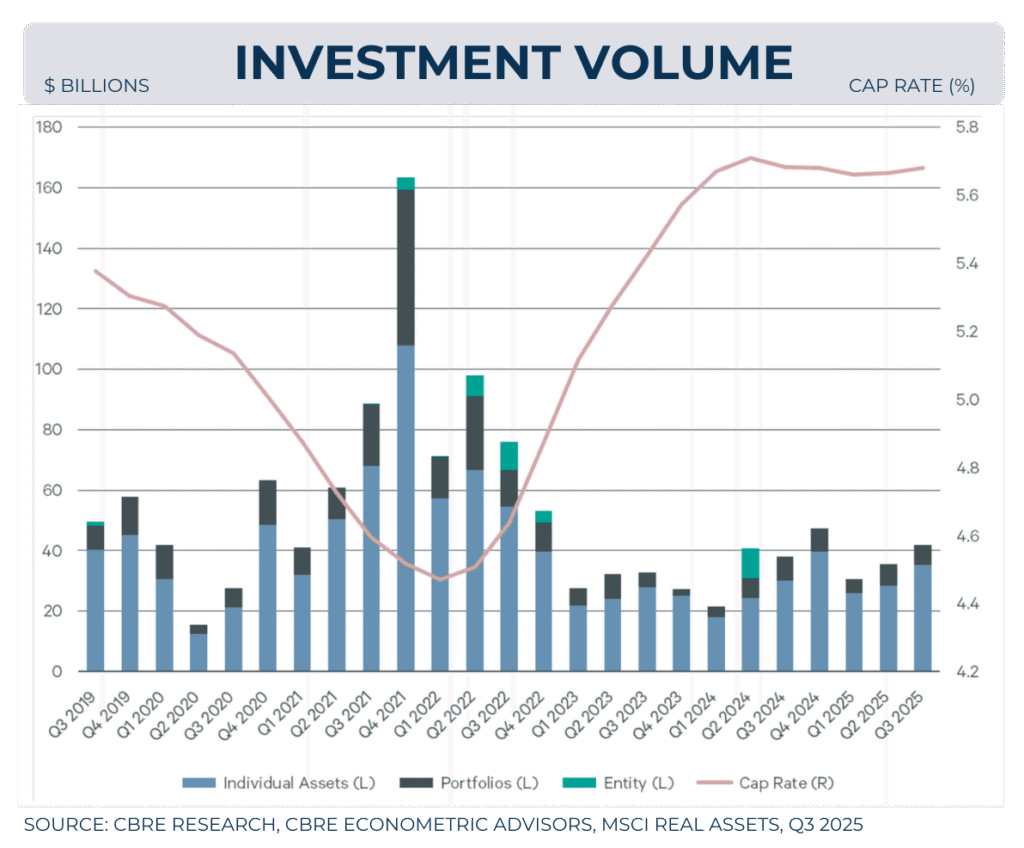
The national multifamily investment market showed signs of recovery and recalibration in the third quarter of 2025, driven by improving investor confidence despite headwinds in rental performance. Multifamily investment volume reached $108 billion, marking a 7.5% increase year-over-year; excluding a major entity-level acquisition by Blackstone in 2024, the year-to-date volume actually rose by 19.4%.
The multifamily investment market remains attractive relative to other sectors, accounting for the largest share of total commercial real estate investment volume in Q3 at 38%. In terms of pricing stability, the average multifamily cap rate remained stable at 5.7% in Q3 2025. This stability in pricing and improving transaction volume indicates that apartments remain a favored target for investors moving capital out of other asset classes.
The data below shows Multifamily investment by quarter along with corresponding cap rate.
Conclusions
The multifamily market is entering an exciting inflection point after two years of historic new supply. Throughout that period, demand for new apartments remained incredibly strong. As we enter Q4 and look ahead to the 2026 leasing season, the fundamentals are aligning favorably. New supply is falling to an 11-quarter low, supporting near-record occupancy levels. The Midwest is expected to continue outperforming the nation, with positive rent growth across our target markets. Investment volume is up 19.4% year-to-date, and cap rates remain stable at 5.7%, reaffirming multifamily’s position as the preferred commercial real estate sector. Taken together, these market dynamics present a compelling entry point for experienced, well-capitalized, and disciplined multifamily investors.