U.S. Economic Overview
The U.S. economy expanded at an annualized rate of 2.3% in the fourth quarter, a slight decline from the post-pandemic average of 3.2%, but roughly in line with the 2.4% average quarterly growth observed during the previous economic expansion from 2010-2019.
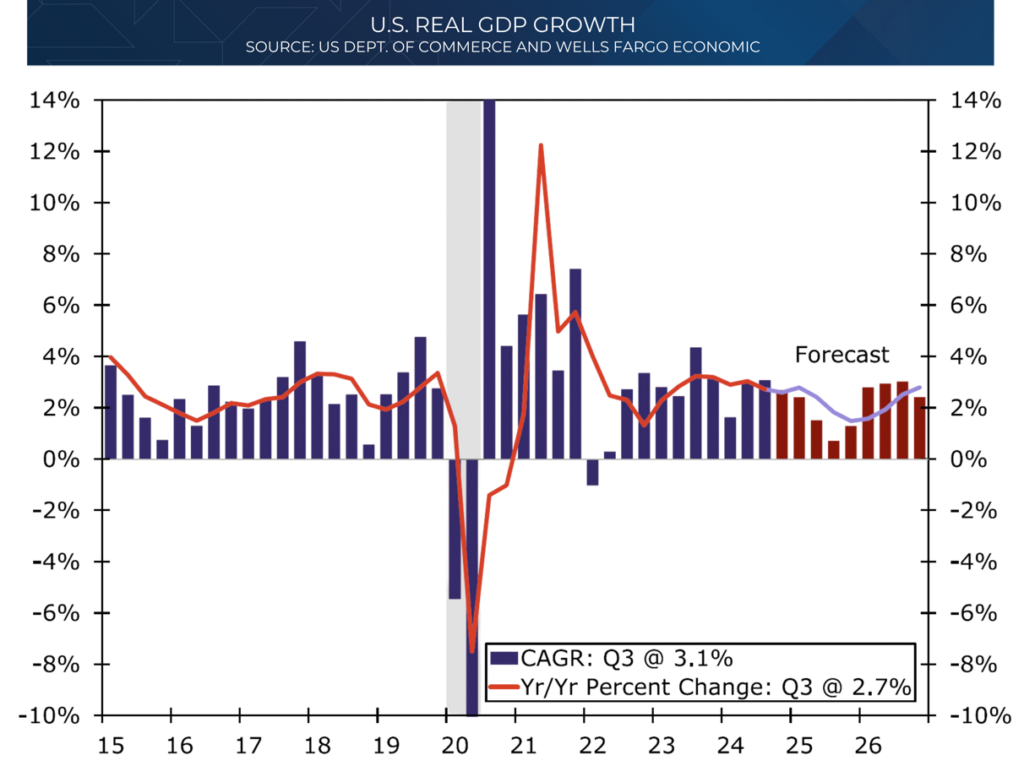
Non-farm payrolls increased by 256,000 in December, significantly surpassing consensus expectations. Looking beyond monthly volatility, employment growth averaged 186,000 jobs per month in 2024, mirroring the pace of payroll growth during the prior expansion. Robust employment gains have contributed to strong increases in real disposable income, supporting growth in real consumer expenditures.
Most businesses remain in solid financial health. While the pace of gross hiring has slowed somewhat in recent months, companies generally do not need or want to cut staff. As long as consumers continue earning income, spending is expected to remain steady.
Interest Rates
In September 2024, the Federal Reserve pivoted, lowering the federal funds rate by 50 basis points, followed by another 25 basis-point cut in November, bringing the target range to 4.50%-4.75%. These moves reflect the Fed’s confidence in achieving its dual mandate of inflation control and full employment. However, the 10-year Treasury rate remained volatile, falling 90 basis points from July to September before rebounding to 4.5% by November.
The chart below shows the timing of interest rate cuts along with the subsequent moves in the yield of the ten-year treasury note.
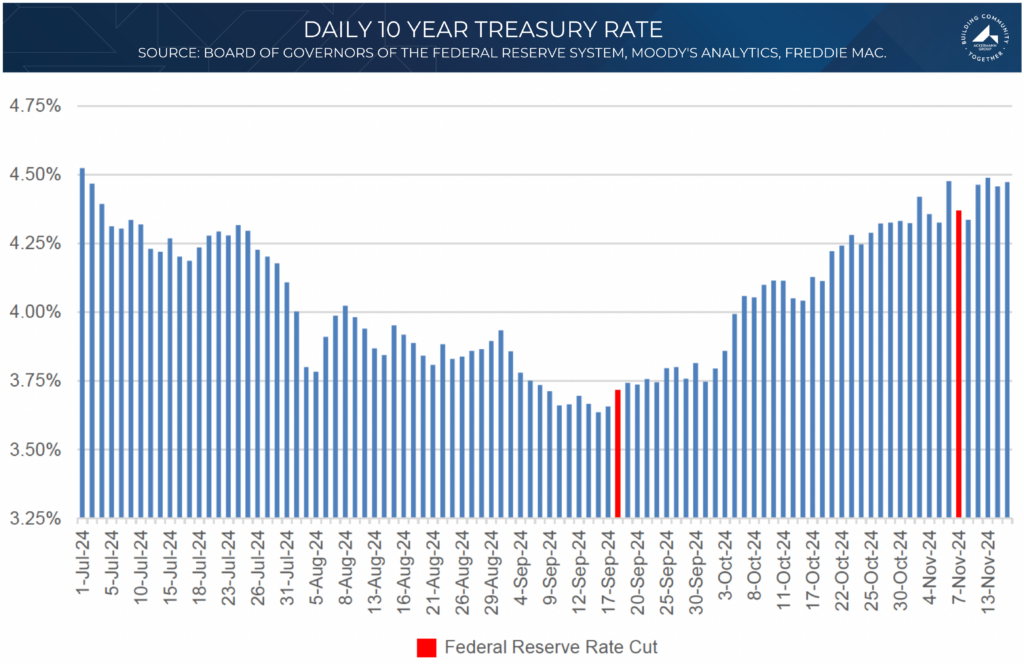
Due to the economy’s recent momentum and the slow progress in bringing inflation back to 2%, it is anticipated that the Federal Open Market Committee (FOMC) will hold rates steady for an extended period, with potentially only two 25 basis-point cuts expected this year—one in September and another in December.
National Apartment Market
2024 marked the peak of the supply cycle, with 588,000 apartment units delivered, the largest amount since 1974. While an additional 470,000 units are expected to be completed in 2025, the market is now on the other side of the supply surge.
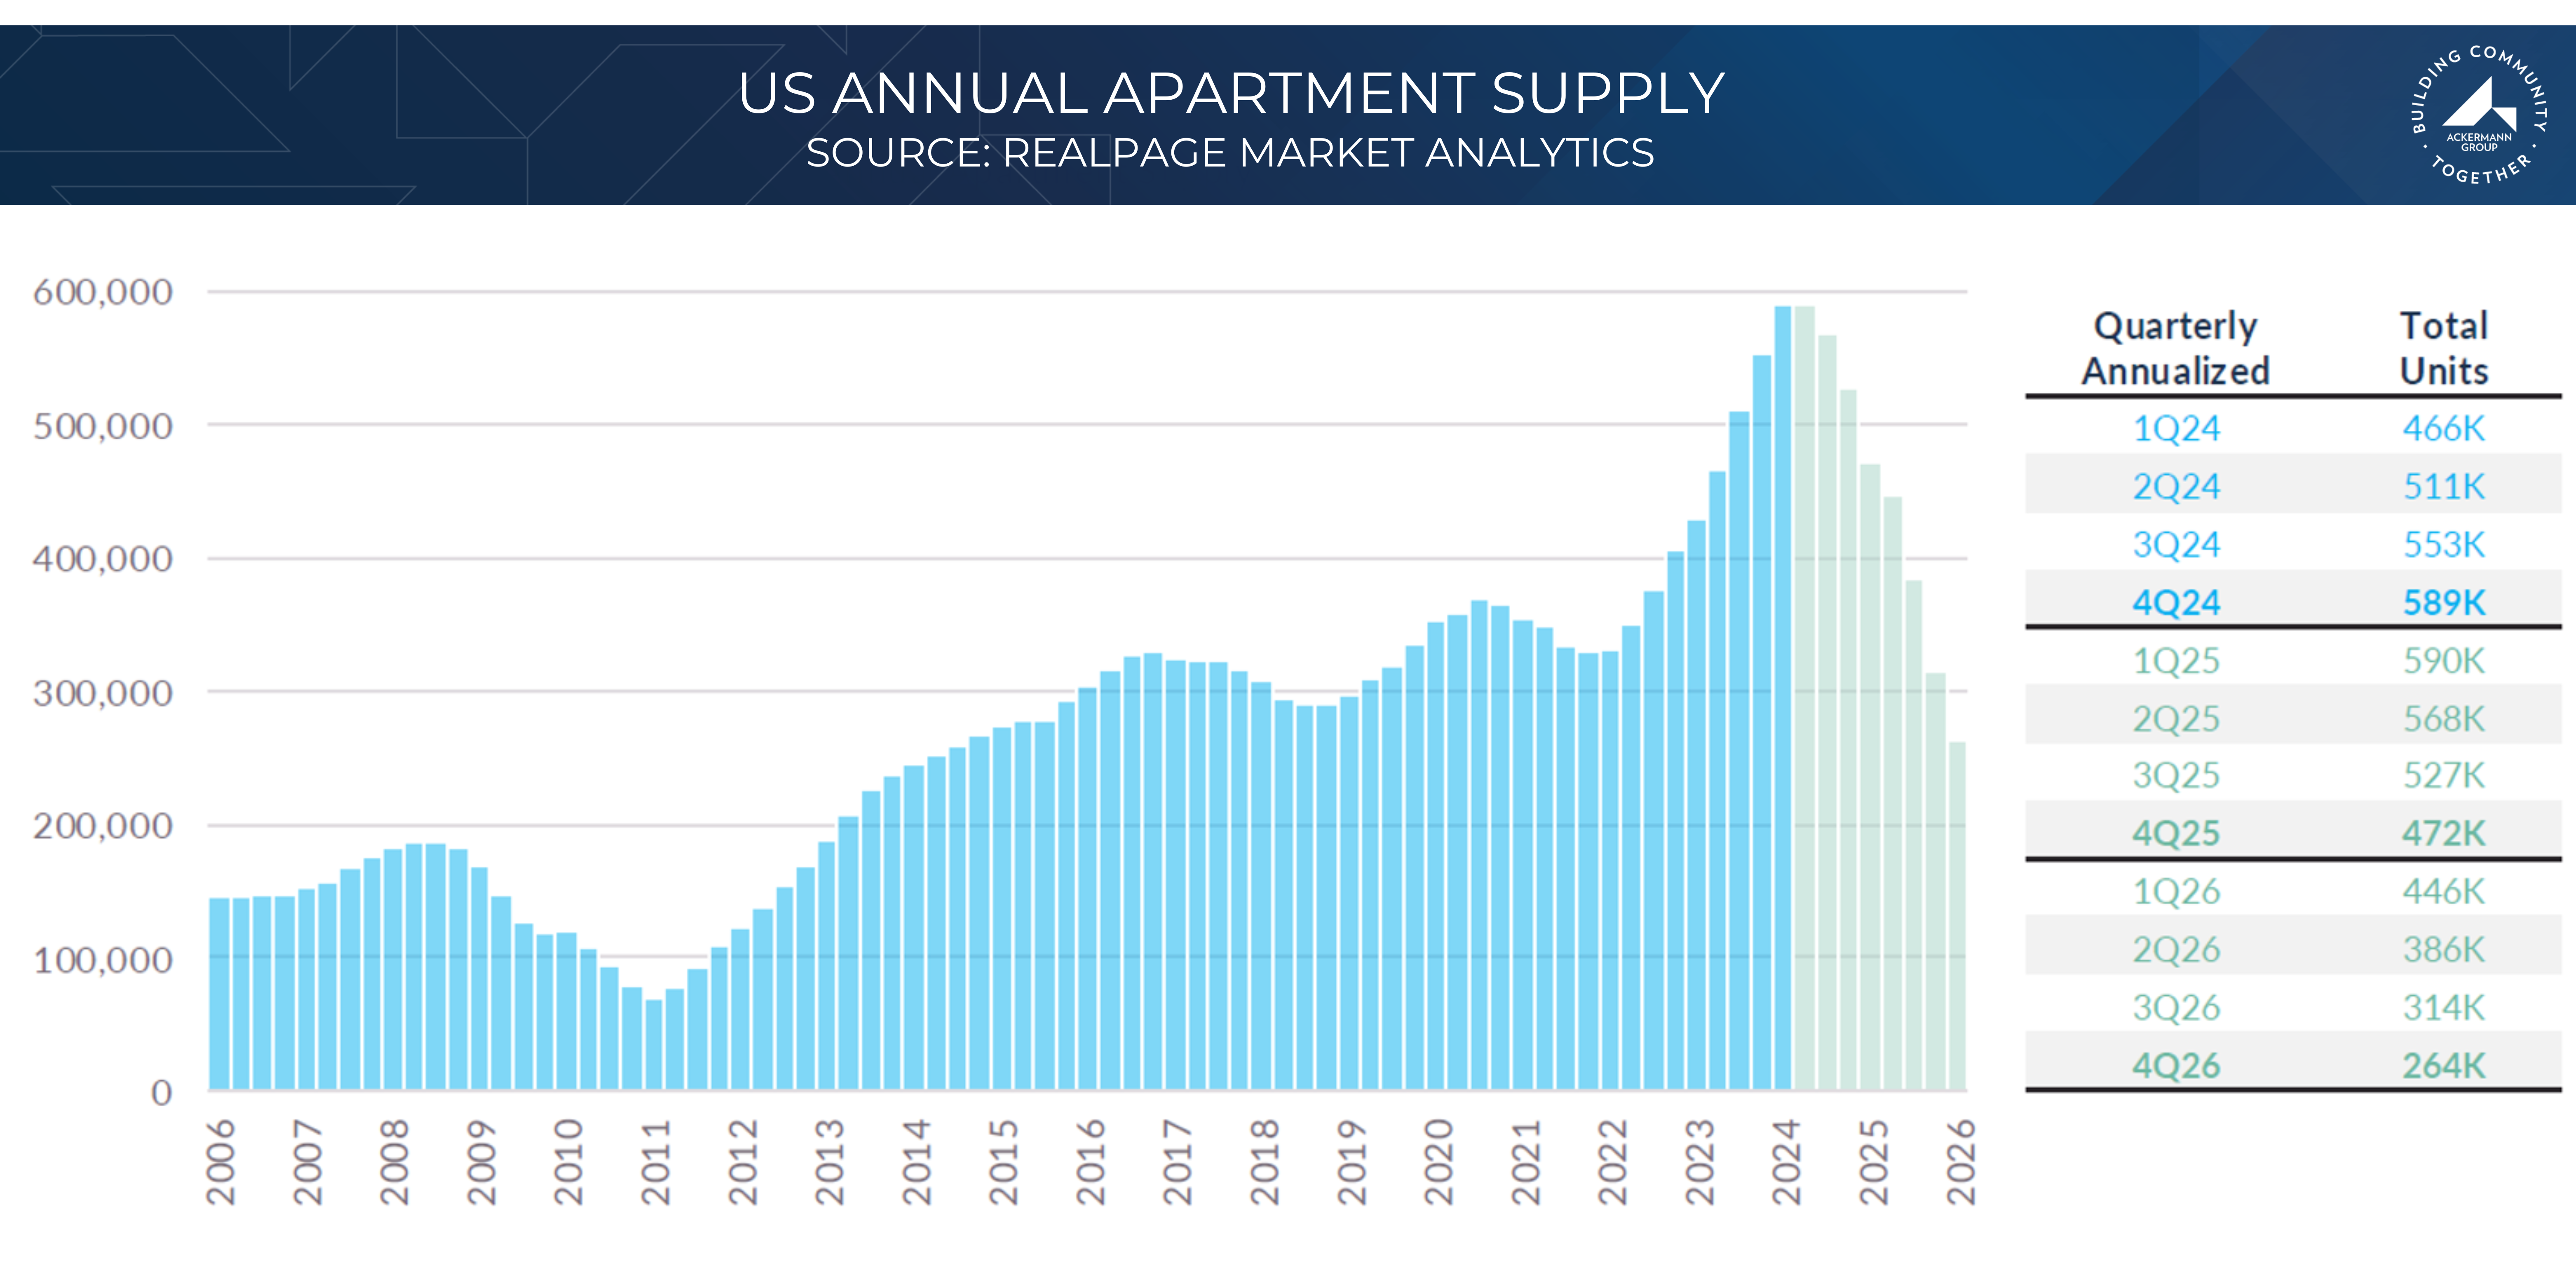
Despite these record deliveries, national rent growth remained positive for the year, coming in at .29%. Occupancy averaged 94.4% in 2024 and was 94.8% for the 4th quarter, a notable achievement given the supply pressures.
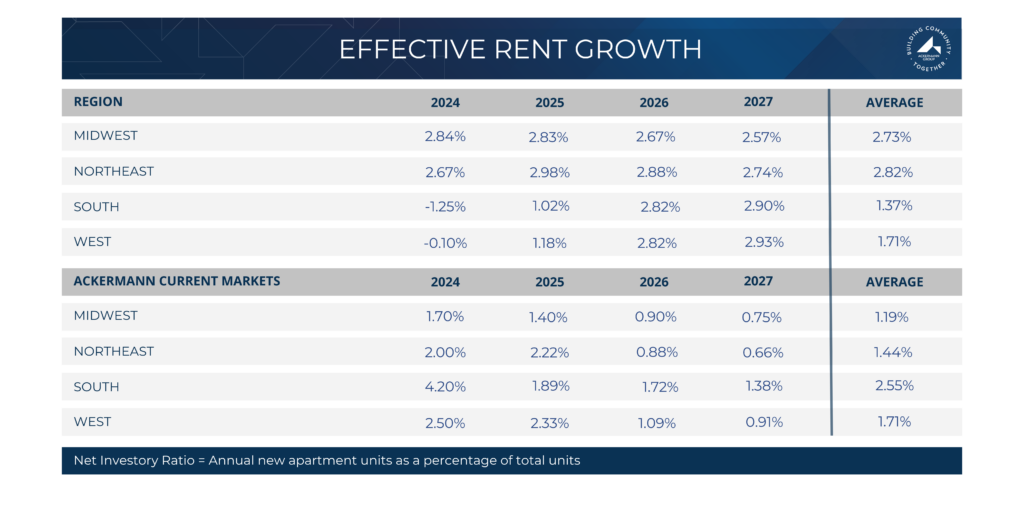
The national apartment market performance is characterized by slow but positive rent growth, but there are certainly regional nuances with the national data. The Midwest and the Northeast regions are currently outperforming the South and West – a direct result of new supply. The data below illustrates this point as the regions with the lowest net inventory ratios also have the highest effective rent growth.
Ackermann Target Markets
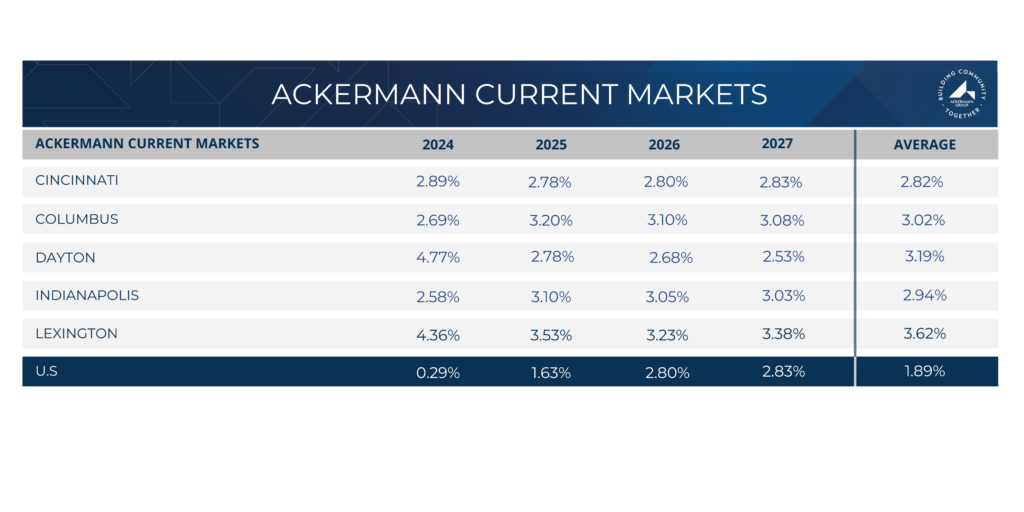
Ackermann’s current and target markets share key characteristics that create an attractive investment environment. Each market is selected based on a history of steady population and job growth, supported by a diverse and thriving employer base. The focus remains on secondary and tertiary markets often overlooked by institutional investors, allowing for more favorable entry points and higher purchase cap rates. These markets also tend to be less volatile in terms of new supply, making rent growth and occupancy projections more predictable.
This strategic approach is evident in the rent growth trends of Ackermann’s markets compared to the broader U.S. market. The data below highlights effective rent growth for current Ackermann markets versus national trends (2024 actual, 2025–2027 projected).
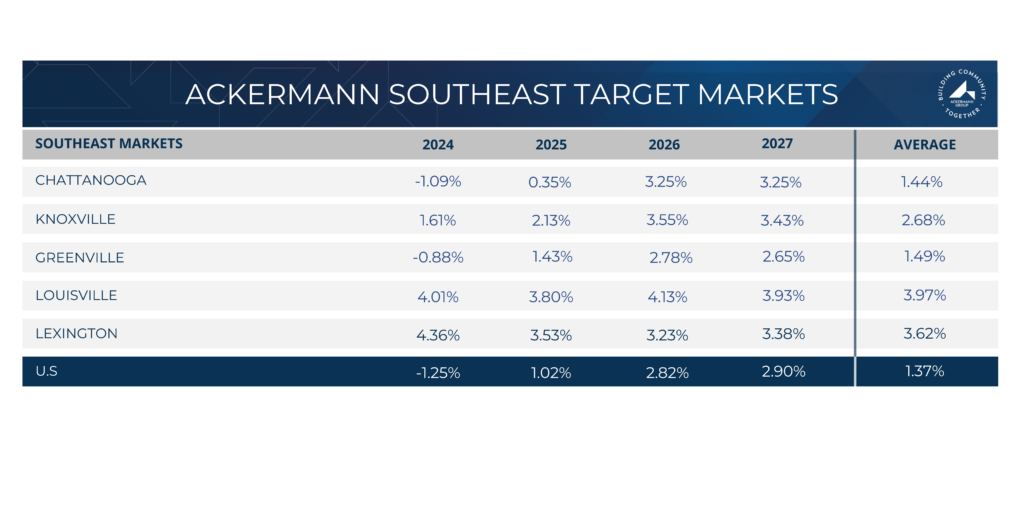
While rent growth across the Southeast has been sluggish, Ackermann’s target markets have demonstrated resilience and are expected to outperform the region through 2027. Markets like Greenville, SC, and Chattanooga, TN, have seen increased supply, whereas inventory growth has been more restrained in Kentucky markets and Knoxville. However, by 2026, all of Ackermann’s Southeast target markets are projected to experience strong effective rent growth, reinforcing the prudence of this investment strategy.
Capital Markets
The capital markets remained generally stable in Q4. Debt financing remains available for multifamily real estate, though at lower leverage points than those seen in 2021 and 2022.
Notably, the Federal Housing Finance Agency increased Fannie Mae and Freddie Mac’s multifamily loan caps to $73 billion each for 2025, a 4% increase over 2024. This move ensures sufficient liquidity in the multifamily lending market, where the agencies hold 49% of outstanding multifamily debt.
A record amount of debt is set to mature over the next two years. In 2024, many lenders and distressed borrowers extended maturity dates, assuming interest rates would decline to facilitate refinancing or sales. However, as 2025 begins, it is becoming clear that rates will remain higher for longer. This shift may lead to increased transaction activity in 2025 and 2026 as lenders lose patience and borrowers become sellers.
Investment Sales
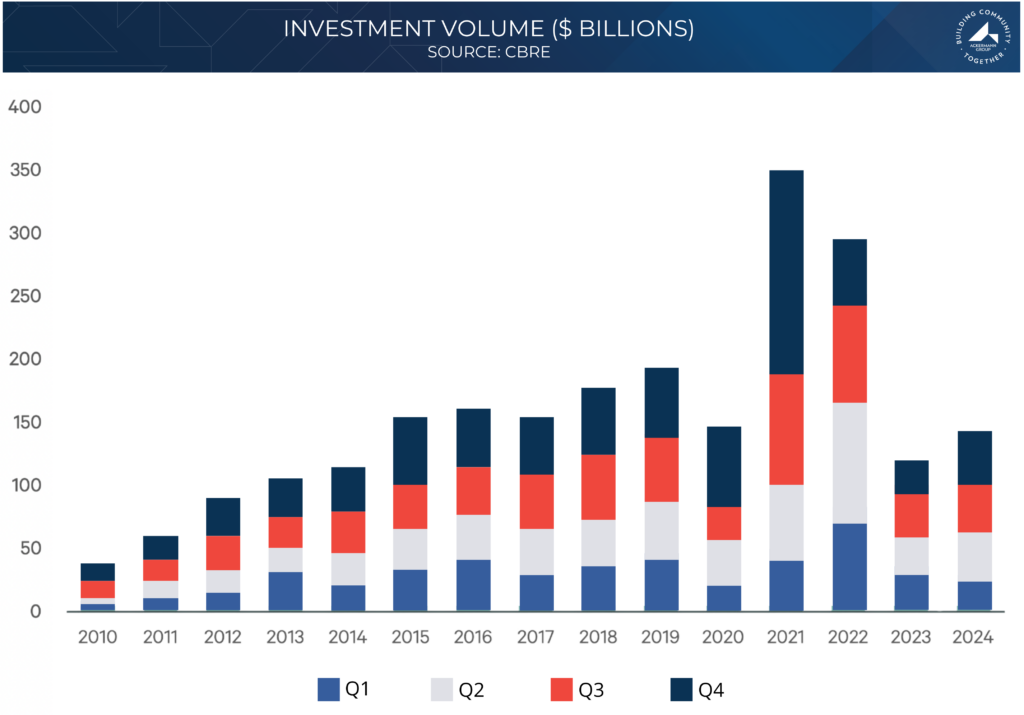
The investment sales market remained sluggish compared to pre-pandemic levels, but activity picked up in Q4. In 2024, multifamily property sales totaled $142.6 billion, marking a 19% increase from 2023. However, this figure remains lower than any year since 2014. Notably, Q4 saw $43.4 billion in sales transactions, a 59% jump from Q4 2023, suggesting a potential market turnaround.
The chart below summarizes investment sales since 2010, color coded by quarter.
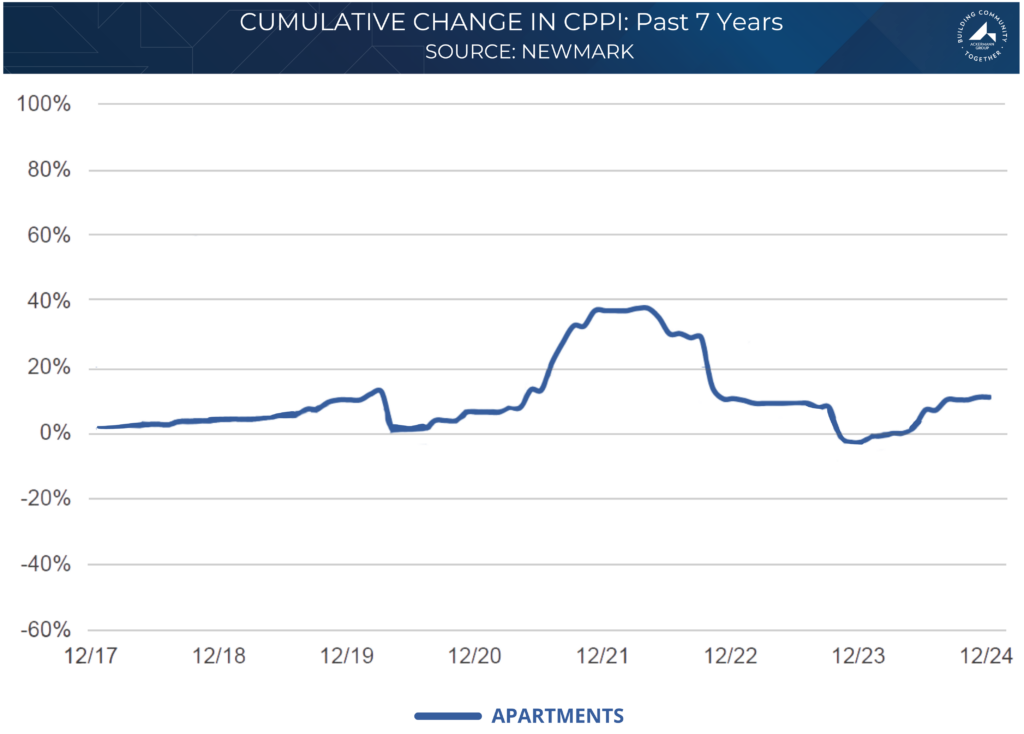
Despite this momentum, institutional investors remain largely on the sidelines due to early hold-period investment yields, even as asset prices are approximately 20% below post-pandemic peaks (Greenstreet Advisors Commercial Property Price Index).
The chart tracks multifamily values indexed to 2017 pricing.
2025 Outlook: Ackermann Forecast
As 2025 begins, the outlook for multifamily real estate appears considerably more stable than a year ago. Concerns around supply growth and interest rate uncertainty dominated early 2024, yet the apartment sector has demonstrated resilience despite record deliveries and shifting economic conditions. The ability of the market to absorb new supply while maintaining occupancy rates above 94% highlights the sector’s durability.
The U.S. economy continues to expand at a steady pace, with GDP and job growth providing a solid foundation for housing demand. While interest rates remain above recent lows, the Federal Reserve’s shift toward a more accommodative stance has brought greater stability to the capital markets. Multifamily lending remains strong, bolstered by increased loan caps for agency lenders, ensuring continued liquidity in the sector. The peak of the supply cycle has passed, and while certain markets are still adjusting, the national apartment market has remained stable, with rent growth holding positive and demand keeping pace with deliveries. As new construction declines in 2026 and beyond, supply and demand fundamentals will increasingly favor existing assets, supporting long-term rent and occupancy growth.
While some macroeconomic uncertainties persist, the long-term trajectory for multifamily investments is promising. With supply tapering off and economic growth expected to remain steady, the sector continues to offer compelling opportunities for investors focused on durable fundamentals and strategic market positioning.